小智BI分发包嵌入
小智BI是一款 UMD 编译文件,在webpack和vite等项目中无需再次编译。直接将开发包库文件放入项目目录下。
1.展示端SDK的下载与嵌入
引入 XZChart/xzchart.js , 可访问全局变量 window.XZDashboard。可将小智BI设计器端创建的报表展示出来。
1.1 SDK获取
开发文件是一款 UMD 编译文件,在webpack和vite等项目中无需再次编译。
联系小智获取试用专属开发包。
1.2 嵌入
开发文件XZChart/xzchart.js 引入后, 可访问全局变量 window.XZDashboard。
实例化XZDashboard后就可以在dom中看到展示效果了,到此已嵌入成功。
原生js嵌入示例
<div id="chartContainer" style="width:100%;height:100%;"></div>
import "./XZChart/xzchart.js";
import "./XZChart/xzchart.css";
//html文件引入方式
//<link rel="stylesheet" href="./XZChart/xzchart.css">
//<script src="./XZChart/xzchart.js"></script>
// reportConfig 图表配置项 reportData 控件初始化数据 paramsConfig 参数面板配置项
let config = { //等同于 4.1设计器保存时调用方法返回数据中的 config字段
"child": [
{
"id": "d5384ef3-4c40-4f28-af88-383b42bda1c4",
"type": "standardBar",
"option": {
"chartConfig": {
"chartBasic": {
"grid__top": 35,
"grid__bottom": 35,
"grid__left": 35,
"grid__right": 35
},
"xAxis": {
"axisLine__show": true,
"axisLine__lineStyle__width": 1,
"axisLine__lineStyle__color": "rgba(0, 0, 0, 1)",
"axisTick__show": true,
"axisTick__length": 5,
"axisTick__lineStyle__width": 1,
"axisTick__lineStyle__color": "rgba(0, 0, 0, 1)",
"axisLabel__show": true,
"axisLabel__rotate": 0,
"axisLabel__interval": 0,
"axisLabel__margin": 10,
"axisLabel__color": "rgba(0, 0, 0, 1)",
"axisLabel__fontSize": 12,
"splitLine__show": false,
"splitLine__lineStyle__width": 1,
"splitLine__lineStyle__color": "rgba(80, 80, 80, 1)"
},
"yAxis": {
"FormatObj__dataFormat__rateValue": -1,
"FormatObj__dataFormat__decimalValue": 0,
"splitNumber": 0,
"axisLine__show": true,
"axisLine__lineStyle__width": 1,
"axisLine__lineStyle__color": "rgba(0, 0, 0, 1)",
"axisTick__show": true,
"axisTick__length": 5,
"axisTick__lineStyle__width": 1,
"axisTick__lineStyle__color": "rgba(0, 0, 0, 1)",
"axisLabel__show": true,
"axisLabel__rotate": 0,
"axisLabel__color": "rgba(0, 0, 0, 1)",
"axisLabel__fontSize": 12,
"splitLine__show": false,
"splitLine__lineStyle__width": 1,
"splitLine__lineStyle__color": "rgba(80, 80, 80, 1)",
"useYAxisMinMax": false,
"yAxisMin": 0,
"yAxisMax": 100
},
"customSeries": {
"content": "",
"show": true,
"position": "top",
"align": "center",
"color": "rgba(0, 0, 0, 1)",
"fontSize": 12,
"rotate": 0,
"distance": 0
},
"tooltip": {
"content": "",
"showContent": true,
"backgroundColor": "rgba(0, 0, 0, 1)",
"textStyle__color": "rgba(255, 255, 255, 1)",
"textStyle__fontSize": 12,
"axisPointer__lineStyle__color": "rgba(0, 0, 0, 0.6)"
},
"barStyle": {
"showBackground": false,
"backgroundColor": "#409EFF",
"barBorRadius": 0,
"barWidth": "50%"
}
},
"dataConfig": {
"data_name": "测试",
"indexs": [
{
"name": "a",
"sort": 0,
"format": null,
"type": "2"
}
],
"columns": [
{
"name": "b",
"sort": 0,
"format": null,
"aggregate": 1,
"type": "2"
}
],
"selectors": [],
"filters": [],
"tooltips": [],
"type": 1
},
"eventConfig": {
"linkage": {
"open": true,
"errorType": 1,
"promptText": "无此联动值"
}
},
"dynamicConfig": {
"marquee": {
"open": false,
"interval": 1000
},
"refresh": {
"open": false,
"type": 1,
"time": [
0
],
"interval": "10"
}
},
"generalConfig": {
"base": {
"backgroundColor": "#00000000",
"background": {
"show": false,
"value": ""
},
"backgroundImage": "",
"backgroundSize": 1,
"borderRadius": "0px",
"boxShadow": false,
"boxShadowLevel": "0px",
"boxShadowVertical": "0px",
"boxShadowColor": "#fff",
"boxShadowLength": "2px",
"boxShadowBlur": "5px",
"borderWidth": "0px",
"borderColor": "#eee",
"padding": "0px"
},
"title": {
"show": true,
"height": "30px",
"backgroundColor": "rgba(0, 0, 0, 0)",
"background": {
"show": false,
"value": ""
},
"backgroundImage": "",
"content": "标准柱状图",
"hyperlink": "",
"fontFamily": "",
"fontSize": "16px",
"color": "#666",
"textAlign": "center",
"textStyle": []
},
"select": {
"show": true,
"height": "30px",
"backgroundColor": "rgba(0, 0, 0, 0)",
"background": {
"show": false,
"value": ""
},
"backgroundImage": "",
"borderWidth": "1px",
"borderColor": "#eee",
"fontSize": "16px",
"color": "#666",
"selectBackgroundColor": "#fff",
"method": 1,
"proportion": "",
"absolute": "",
"spacing": "0px"
}
}
}
}
],
"layout": {
"report": {
"width": "1920px",
"height": "1080px",
"padding": "0px",
"single_height": "1080px",
"backgroundColor": "#fff",
"backgroundImage": "",
"backgroundSize": 1
},
"d5384ef3-4c40-4f28-af88-383b42bda1c4": {
"width": "960px",
"height": "540px",
"zIndex": "99",
"transform": "translate(0px, 0px)"
}
}
}
let option = {reportConfig:config,reportData:[],paramsConfig:[]}
const reportInstance = new XZDashboard("#chartContainer", option);
let data = [ //等同于 4.1设计器保存时调用方法返回数据中的 data.dataConfig字段
{
name:"测试",
type:1, // 1 Json数据 3 API数据
response_data:[ //Json数据格式
{
a:1,
b:2
}
]
}
]
reportInstance.updateData(data);
// 数据改变时 需要使用 updateData 方法更新 data,apiConfig 都是可选参数
// type 1 json数据 reportInstance.updateData(data?)
// type 3 API服务 reportInstance.updateData(data?,apiConfig?)
//画布显示自适应事件 有需要时在执行
// reportInstance.initView();
Vue嵌入示例
<template>
  <div id="chartContainer" style="width:100%;height:100%;"></div>
</template>

<script setup>
import { ref, onMounted } from 'vue';
import "@/assets/XZChart/xzchart.js";
import "@/assets/XZChart/xzchart.css";

let reportInstance = null;
let option = {reportConfig:{},reportData:[],paramsConfig:[]};
onMounted( () => {
  const reportInstance = new XZDashboard("#chartContainer", option);
  reportInstance.updateData(data);
});
React嵌入示例
Angular 嵌入示例

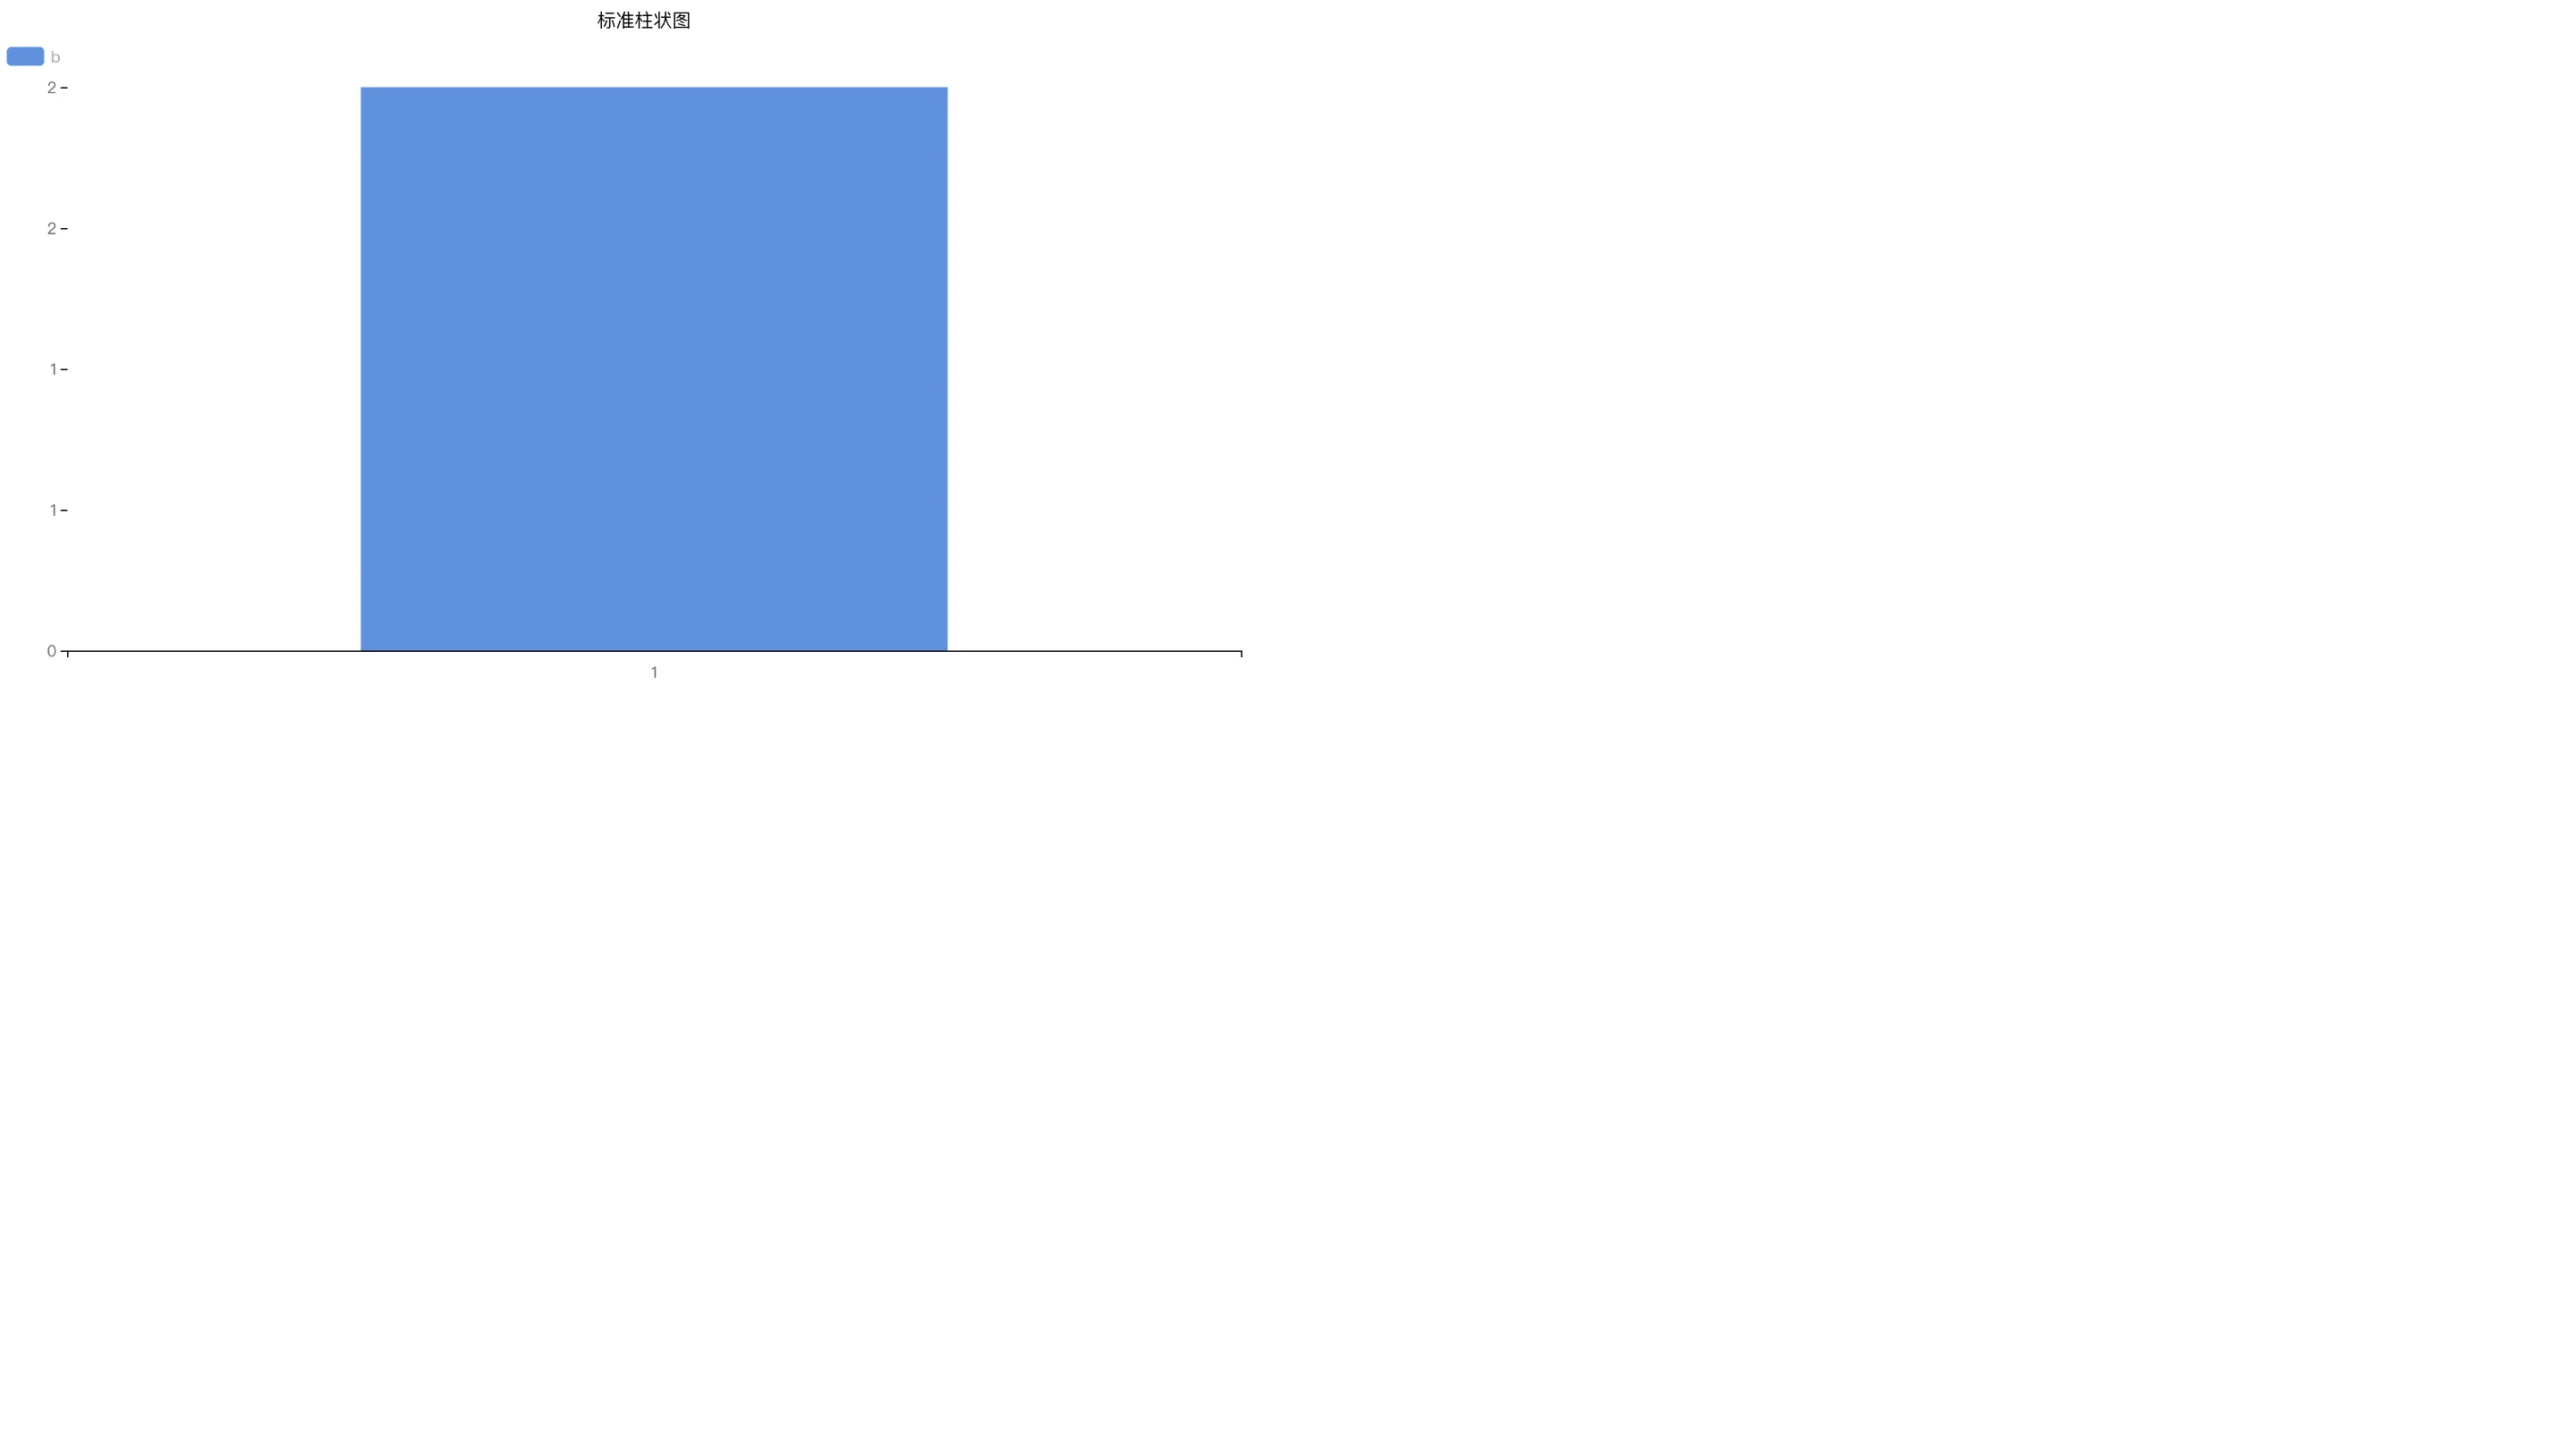
Preview
2. 展示端Json数据回调事件
在设计器端使用的onUpdateDatasetList方法获取Json数据时,在展示端也有onUpdateData来获取外部数据,进行数据的更新。
在小智BI展示端初始化时设置option字段来实现。
// datasets => [{name:"数据表名称",id:"数据表id"...}]  参与获取数据的数据集
// params => [{name:"参数名称",value:"参数值"}]  value的类型是字符串或者数组
// 该方法的返回值是一个Promise
const onUpdateData = (datasets,params)=>{
  ...
  return new Promise((resolve, reject)=>{
    // resolve的数据格式
    let results = [
      {
        name:"测试", //必填项
        id:"测试" //必填项
        response_data:[] // [{a:1,b:2}]
      }
    ]
    resolve(results)
  })
let option = {reportConfig:config,reportData:[],paramsConfig:[],onUpdateData}
3. 展示端自适应移动设备
注意:适用范围仅限于【小智BI】模块--【电脑+移动端】
【电脑+移动端】BI图表的展示端 默认为Pc端类型,加上此代码后显示为移动端:previewType:"app"
如果想动态切换,把previewType值跟url参数(mode)关联下,即url上拼接mode=app,以此来实现同一张BI报表,在电脑端与手机端同时查看
备注:移动端设计样式参考此文档:https://doc.tizdata.com/xzkfzpt/1297